 A Search for Xanthippe
| Insectivora | ||
| The Vertebrates | Insectivora and Molecular phylogeny |
| Vertebrates Home | Vertebrate | Vertebrate |
|
Abbreviated Dendrogram
Eutheria
│
├─Insectivora
│ ├─Micropternodontidae
│ └─┬─Erinaceomorpha
│ └─Soricomorpha
│ ├─Tenrecoidea
│ └─┬─Solenodontidae
│ └─┬─Talpoidea
│ └─Soricoidea
│ ├─Apternodontidae
│ └─Soricidae
│ ├─Crocidurinae
│ └─Soricinae
└─┬─Chrysochloroidea
└─Afrotheria
|
Contents
Index |
A Search for XanthippeXanthippe is a fascinating study -- part myth, part academic tradition, part literary figure and in part, undoubtedly, a real person. She was the wife of Socrates, although considerably younger than her husband. He may have had a prior marriage, although there is no record of such an event. They had three sons together, one of whom was still in arms when Socrates was executed in 399 BC at the age of 71. We know Xanthippe mostly from occasional mention in the writings of Socrates' pupil, Plato. Plato was a puffed-up, jealous, sanctimonious and self-centered jerk who thought little of his fellow man -- and far less of his fellows' women. Perhaps for this reason, Xanthippe has come down to us through scholarly tradition as history's first recorded bitch. In reality, she must have been an extraordinary and complex person: bright and articulate enough to argue with the greatest philosopher of the age, but not an εταιρα [1], passionate enough to interest a notably unworldly man in his old age, but practical enough to run the household for one of history's most notoriously impractical slobs, a man who reportedly lived on irregular handouts (he refused to charge fees) from his wealthy pupils.
But the point of this abstruse discourse is that Xanthippe's name is now firmly welded to her epithet, "the Shrew." We are, in fact, looking for early shrews and we will do so in a thoroughly shrewish and intemperate way. We may actually go so far as to castigate and abuse some other) impractical old slobs who, in our grossly biased opinion, have invented a perfectly useless kind of science and ought to go out and get a real job. Thus, you see, we will search for the real Xanthippe, and will also do so in such a manner as to render due homage to her reputation.
 As this essay is a Philippic, that is a dyspeptic, rather than dispassionate, inquiry, it is only fair to start with our conclusion. Our theme is that most DNA phylogeny, as practiced today, is a pointless waste of good organic reagents which would be better employed in, for example, the manufacture of plastic martini picks. The reason for this is not that molecular biology is inherently irrelevant to phylogenetic questions. Nor are we concerned that the molecular biologists lack sufficient appreciation for what happens to whole animals. To the contrary, the molecule folks have often shown an embarrassing degree of insight into whole- animal issues. No -- the problem is that the molecular biologists have simply done rotten molecular biology. They have failed us here because they have been pig-headedly devoted to a research paradigm which is simply wrong. In fact everyone has known it was wrong for at least ten years. Worse, in blindly following this paradigm, the molecular brotherhood routinely discard the very evidence which might be phylogenetically useful and informative, simply because this data fails to conform to some preconceived notions of what the data set ought to look like.
To understand what their paradigm is, we must go back yet another decade or two to the time when a few labs were doing the first, clumsy, cloning and sequencing experiments with DNA [2]. Even the least imaginative of that generation already dreamed of the possibility of solving all of life's evolutionary riddles in a week, given the right sequences.
It all seemed so simple. In DNA, we had thousands of data points at our disposal. Rather than putter around in dusty museums, searching for third hand morphological information, we could look directly at the fundamental source code of life. Every position would be reasonably independent of the others, and there were only 4, well-defined states possible for each site along the DNA sequence, with no intermediates. There could be few messy issues of homology, and far less worry about convergences and homoplasies. We would simply read the branching pattern of evolution from the linear string of DNA. What could possibly go wrong?
As every experienced megalomaniacal villain knows, it is at that point -- the point at which one gleefully shouts, "Nothing can stop me now!" -- that it all falls apart. And so it did. For almost every statement made in the preceding paragraph turns out to be dead wrong. To see why, let us examine some of the experiments from a paper of special relevance, Stanhope et al. (1998) [S+98] and other work largely associated with Prof. Ulfur Arnason of the University of Lund.
 Stanhope and his colleagues have been active in promoting the "Afrotheria," a supposed clade of endemically African mammals including elephants, elephant shrews, hyrax, aardvarks, sirenians, tenrecs and golden moles (Chrysochloroidea). Parts of this grouping are stunningly non-controversial. The hyrax- elephant- sirenian core is well-accepted on morphological grounds. The rest seems questionable, or downright bizarre, depending on the particular experimental results one is discussing. The actual results vary a great deal from one experiment to the next. The reader may recall that the Moleculariat has also soberly announced, in one case, that rabbits were the sister group of apes. In fact, [S+98] is one of the papers on which this particular piece of lunacy was based. But more to the point in this section, the Afrotheria hypothesis requires that the Insectivora be strongly polyphyletic. That's a serious issue. Despite superficial similarity, not much holds Insectivora together from a morphological point of view. Polyphyly is a realistic possibility, so [S+98] (and associated work) has received a good deal of attention.
Stanhope etc. actually combined a number of ordinal level surveys in this paper. They looked at mitochondrial ribosomal DNA (mtrDNA) sequences, a portion of the gene for vonWillibrand factor (vWF), the gene coding for the α-2B adrenergic receptor (A2AB), and the α- and β- globin genes. The object of this essay is not to trash Arnason & Co. -- or even the Afrotheria -- but to make a point about a way of thinking. Thus, we will arbitrarily take on the first of these experiments, and leave the vWF, A2AB and globin studies as an exercise for the reader. "Sufficient unto the day is the evil thereof."
 ... Mitochondria, and Mammals.
Mitochondrial DNA has always had a special attraction for phylogenetics. Since each mitochondrion has (at least) one copy of the whole molecule, there's lots of it. The mammalian mitochondrial DNA (mtDNA) molecule is small (~17 kBP), uniform, GC-rich and circular. Since these characteristics strongly affect centrifugal and electrophoretic mobility, it was possible to isolate relatively pure mtDNA even before PCR methods made gene isolation about as technically challenging as heating coffee.
In addition to these practical advantages, mitochondria reproduce asexually, are always inherited from the mother and don't undergo recombination. There may be exceptions to both statements, but the exceptions are exceedingly rare. It also happens that the gene order and gene content of mtDNA is constant throughout the Theria. This stability is not found in all vertebrate groups. See essay at Cuculiformes. The stability is convenient because it moots many potential issues of homology. Finally, there are no introns and only one control region. Thus, except for the one small control region, we know the purpose of almost every nucleotide: each nucleotide is either coding for an amino acid in an identified protein, or for some identified ribosomal or transfer RNA. As it turns out, mammalian mtDNA only contains genes for two rRNAs, 22 tRNAs, and a series of proteins involved in the mitochondrial electron transport pathways. A map is provided for those who can't watch a show without buying a program.
Stanhope et al. used the portion of the mitochondrial genome coding for the 12S and 16S rRNAs. This fragment also contains the valine tRNA gene. They either sequenced this fragment or obtained published sequences for a wide variety of mammals, covering almost all traditional orders of the Eutheria. They compared these sequences using several different methods: parsimony the usual method for morphological studies), nearest neighbor joining, and maximum likelihood. Representative results are provided below. These results are taken from later papers by members of the same group, using the same basic methods, but with much more complete sequences. Arnason & Janke (2002); Arnason et al. (2002). (The earlier papers, [S+98] and [S+98a], yielded huge and uninteresting polytomies, from which one could recover Afrotheria, but almost nothing else.) For comparative purposes, we also include the current scheme used in Palaeos. The Afrotheria are, indeed, recovered in almost all cases. The clade is strongly supported by maximum likelihood analysis. Likewise, the polyphyly of the Insectivora is profound and strongly supported.
But enough. We have built up our straw man in good faith and as stoutly as possible. It is now time to burn him down.
Note first the strong differences between the two results presented by [AJ02]. Although Afrotheria is recovered in both cases, its internal structure and external placement are extremely different. Its important to note that these results do not reflect different data sets. The two cladograms are generated from the same data set, using different assumptions. Thus the first lesson is that molecular phylogenies are very sensitive to operating assumptions. We will return to this matter shortly. The second lesson is that molecular phylogenies are even more unstable at deep nodes than morphological trees. It would be amusing to compile the various position at which Afrotheria has been placed between 1997 and 2003, but not really useful. Generally speaking, the clade is either quite basal, or appears in the Glires-Archonta region. So far as we are aware, the only position in which Afrotheria has not been found is where morphology places its undisputed core, deep within the ungulates.
|
Eutheria
├─Erinaceomorpha
└─┬─Muridae
└─┬─┬─┬─Thryonomyidae
│ │ └─Caviidae
│ └─┬─Sciuridae
│ └─Gliridae
└─┬─┬─┬─Tarsiiformes
│ │ └─Strepsirhini
│ └─┬─Dermoptera
│ └─Anthropoidea
└─┬─┬─Lagomorpha
│ └─Scandentia
└─┬─┬─┬─┬─Hyracoidea
│ │ │ └─┬─Sirenia
│ │ │ └─Proboscidea
│ │ └─┬─Tubulidentata
│ │ └─┬─Macroscelidia
│ │ └─Tenrecoidea
│ └─Xenarthra
└─┬─┬─Talpoidea
│ └─Soricoidea
└─┬─Chiroptera
└─┬─┬─Perissodactyla
│ └─┬─Pholidota
│ └─Ferae
└─Cetartiodactyla
├─┬─Suoidea
│ └─Camelidae
└─┬─Bovoidea
└─┬─Hippopotamidae
└─Cetacea |
Eutheria
├─Erinaceomorpha
└─┬─Xenarthra
└─┬─┬─┬─┬─Tubulidentata
│ │ │ └─┬─Hyracoidea
│ │ │ └─┬─Sirenia
│ │ │ └─Proboscidea
│ │ └─┬─Macroscelidia
│ │ └─Tenrecoidea
│ └─┬─┬─┬─Scandentia
│ │ │ └─Muridae
│ │ └─┬─Sciuridae
│ │ └─┬─Gliridae
│ │ └─┬─Thryonomyidae
│ │ └─Caviidae
│ └─┬─Lagomorpha
│ └─┬─Strepsirhini
│ └─┬─Tarsiiformes
│ └─┬─Dermoptera
│ └─Anthropoidea
└─┬─┬─Talpoidea
│ └─Soricoidea
└─┬─Chiroptera
└─┬─┬─Pholidota
│ └─Ferae
└─┬─Perissodactyla
└─Cetartiodactyla
├─┬─Suoidea
│ └─Camelidae
└─┬─Bovoidea
└─┬─Hippopotamidae
└─Cetacea |
Eutheria
├─Xenarthra
└─┬─┬─Pholidota
│ └─┬─Erinaceomorpha
│ └─┬─Tenrecoidea
│ └─┬─Talpoidea
│ └─Soricoidea
└─┬─┬─┬─Macroscelidia
│ │ └─┬─Lagomorpha
│ │ └─┬─┬─Thryonomyidae
│ │ │ └─Caviidae
│ │ └─┬─Sciuridae
│ │ └─┬─Gliridae
│ │ └─Muridae
│ └─┬─┬─Scandentia
│ │ └─┬─Strepsirhini
│ │ └─┬─Tarsiiformes
│ │ └─Anthropoidea
│ └─┬─Dermoptera
│ └─Chiroptera
└─┬─Ferae
└─┬─┬─┬─Perissodactyla
│ │ └─Tubulidentata
│ └─┬─Hyracoidea
│ └─┬─Sirenia
│ └─Proboscidea
└─Cetartiodactyla
├─Cetacea
└─┬─┬─Suoidea
│ └─Hippopotamidae
└─┬─Camelidae
└─Bovoidea |
Eutherian phylogeny based on amino acid sequences calculated from complete mtDNA sequences. [AJ02] & [A+02]. Putative Afrotheria are in red, morphological Insectivora in blue. |
Eutherian phylogeny based on mtDNA sequences using only 1st & 2nd codon positions. [AJ02]. |
Eutherian phylogeny based largely on morphology: current Palaeos consensus tree. |
The internal membership and organization of the group shows at least as much variability.So, for example, tenrecs and Chrysochloroidea are often found to be sisters within Afrotheria. See, e.g., Douadya et al. (2002). But Mouchaty et al. 2000) recover a tenrec- aardvark- elephant clade. Sloths are sometimes found in Afrotheria [S+98], but more usually not. Other members of the Xenarthra may or may not also be included. Arnason et al. (2002). Similarly, the organization of the remaining insectivore groups shows little constancy. The 1998 Stanhope papers place moles and shrews at some distance from hedgehogs and Afrotheria. However, Douadya et al. (2002) resurrect the Insectivora, minus the tenrecs and golden moles. Meanwhile, Mouchaty et al. 2000a) assert that moles and bats are sisters ... If one strays beyond the mtDNA area into nuclear gene phylogenies, the variability is even more striking.
Of course it would be unfair to demand too much consistency. The research has just begun, hasn't it? Perhaps when these hypotheses have been better tested we'll have better consistency. Or so goes the refrain.
Hypotheses which are falsifiable will improve as various competing ideas are falsified. But how might one falsify an mtDNA phylogeny? If with nuclear genes or morphology, then perhaps we ought to be relying on them in the first place. We can use more of the mitochondrial genome, of course, and we can add more species. However, in the last analysis we have only 17kBP of mtDNA and no real way to tie that to what happens to real animals. Worse, in most cases, we cannot even be sure what the sequences themselves represent. Although there are ordinal level studies galore, the field has only now begun to produce a few analogs to the alpha taxonomy of morphologists: studies aimed at determining the range and types of variation at the species or population level. These, as we will see, have already generated some disturbing results.
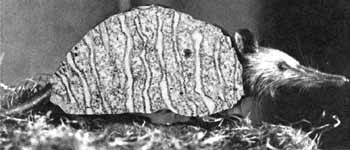
 Most critically, we can't tie the mtDNA results to fossils at all. Recently, for example, Seiffert & Simons (2000) have described Widanelfarasia from Eocene sediments in Egypt. Widanelfarasia looks suspiciously intermediate between tenrecs, chrysochloroids, and Solenodon, an unusual, non-Afrotherian insectivore. No solenodont has ever been found in Africa. It is perhaps as secure a non-Afrotherian insectivore as one could hope to find. What can the molecular workers do with Widanelfarasia? Nothing, of course. It lies completely outside the realm of that discourse.
The case is not quite hopeless. One could imagine the development of mathematical tools capable of integrating the results of morphological and molecular data sets. We can already do this in a crude fashion with so-called "supertrees." This approach has recently been applied to mammalian ordinal relationships by Liu et al. (2001). We have pruned their data to the taxa used by the Stanhope group and reorganized the results in the table below. The results are interesting, but not yet convincing. The current techniques simply compromise between the end results of disparate studies. They do not actually reconcile the underlying data sets. Some considerably more sophisticated tool is needed [3].
But we have promised to discuss the matters of assumptions and alpha taxonomy. These matters are related, so we may deliver on both promises at once.
| Eutheria
├─Xenarthra
└─┬─┬─┬─Hyracoidea
│ │ └─┬─Proboscidea
│ │ └─Sirenia
│ └─┬─Macroscelidia
│ └─Tubulidentata
└─┬─┬─┬─Tenrecoidea
│ │ └─Chrysochloroidea
│ └─┬─Erinaceomorpha
│ └─┬─Solenodontidae
│ └─┬─Soricoidea
│ └─Talpoidea
└─┬─┬─Lagomorpha
│ └─┬─┬─Sciuridae
│ │ └─┬─Muridae
│ │ └─Gliridae
│ └─┬─Thryonomyidae
│ └─Caviidae
└─┬─┬─Dermoptera
│ └─┬─Scandentia
│ └─Primata
└─┬─Chiroptera
└─┬─┬─Pholidota
│ └─Ferae
└─┬─Perissodactyla
└─┬─Cetacea
└─┬─Suoidea
└─┬─Camelidae
└─┬─Hippopot.
└─Bovoidea |
Eutheria
├─┬─Erinaceomorpha
│ └─┬─Solenodontidae
│ └─┬─Soricoidea
│ └─Talpoidea
└─┬─┬─┬─Thryonomyidae
│ │ └─Cavidae
│ └─┬─Muridae
│ └─┬─Gliridae
│ └─Sciuridae
└─┬─Lagomorpha
└─┬─┬─Primata
│ └─┬─Dermoptera
│ └─Scandentia
└─┬─┬─Xenarthra
│ └──┬─┬─Macroscelidia
│ │ └─Tubulidentata
│ └─┬─┬─Tenrecoidea
│ │ └─Chrysochloroidea
│ └─┬─Sirenia
│ └─┬─Hyracoidea
│ └─Proboscidea
└─┬─Chiroptera
└─┬─┬─Ferae
│ └─Pholidota
└─┬─Perissodactyla
└─┬─Suoidea
└─┬─Camelidae
└─┬─Cetacea
└─┬─Hippopot.
└─Bovoidea |
Eutheria
├─Xenarthra
└─┬─┬─Erinaceomorpha
│ └─┬─Chrysochloroidea
│ ├─Tenrecoidea
│ └─┬─Solenodontidae
│ ├─Soricoidea
│ └─Talpoidea
└─┬─┬─┬─Macroscelidia
│ │ └─┬─Lagomorpha
│ │ └─┬─┬─Muridae
│ │ │ └─┬─Cavidae
│ │ │ └─Thryonomyidae
│ │ └─┬─Sciuridae
│ │ └─Gliridae
│ └─┬─Scandentia
│ └─┬─Primata
│ └─┬─Dermoptera
│ └─Chiroptera
└─┬─┬─Pholidota
│ └─Ferae
└─┬─Tubulidentata
└─┬─┬─Cetacea
│ └─┬─Perissodactyla
│ └─┬─Hyracoidea
│ └─┬─Proboscidea
│ └─Sirenia
└─┬─Suoidea
└─┬─Camelidae
└─┬─Hippopot.
└─Bovoidea |
Complete Eutherian "supertree" combining molecular and morphological data [L+01]. Putative Afrotheria are in red, morphological Insectivora in blue. |
Eutherian "supertree" based on molecular studies [L+01]. |
Eutherian "supertree based on morphological studies [L+01]. |
The problem of saturation is the molecular equivalent of long-branch attraction in morphological studies. Suppose we are working with a site which, on average, mutates randomly once every 3 My. If we use that site in a study of mammalian ordinal relationships, the result is pure noise. The site will have changed approximately 20-25 times since the Eutherian orders diverged. It can tell us nothing useful. Only sites which change on the same scale as the study can add to our knowledge.
In making these statements, we have used "mutate" in a very loose way. The rate of mutation, in this sense, conflates an actual underlying mutation rate with the probability that the mutation becomes fixed in the population and the rate at which any fixation occurs. The underlying rate of mutation may be constant. We will discuss reasons why this is not a good assumption. But there is no reason to believe that the rate or probability of fixation is constant, since -- even if we assume all mutations are neutral -- both are strongly influenced by population size and generation time. Li (1997). We have no reason at all to assume that population size and generation time are either constant or behave in some statistically unbiased manner over timescales of over 50 My.Similarly, we cannot assume that all possible states of that site are completely neutral, or -- even if they are all neutral at some given point in time -- that the assumption of neutrality may be maintained over 50 - 100My [4].
In fact, we know, to a certainty, that mitochondrial rDNA is badly behaved, to an unusual degree, with respect to most of these assumptions.
1) Eutherian mtDNA changes (on average) at a very rapid clip. The mitochondrial protein coding genes have been estimated to change at a rate almost ten times the rate of nuclear genes [L97].
2) mtrDNA mutation rates are highly heterogeneous. Some protein binding regions are so conservative that they are essentially invariant. Springer & Douzery (1996). By contrast, the molecules also contain hypervariable loops which have few constraints on either sequence or size. Springer et al. (1995).
 3) rRNA has a very complex secondary structure. There are many regions of the molecule which fold back on each other and are at least partially double-stranded. If a base changes in one of these double-stranded "stem" regions, selection will favor a "reciprocal" change in order to maintain a secondary structure (which presumably has functional significance). Springer et al. (1995) (by the Arnason group) have argued that such reciprocal mutations happen relatively slowly. That argument misses the point. The point is that the "mutation" rate is not constant over time for reasons intrinsic to the molecule, as well as the externally-driven variability discussed above.
4) rRNA also has an incredibly complicated tertiary structure which is governed by its relationships to the numerous proteins of the mitochondrial ribosome. Springer & Douzery (1996). To a varying and unpredictable extent, these interactions introduce the same complication. That is, a mutational change in the ribosomal protein, will increase selection pressure favoring complimentary mutations in the ribosomal RNA. This complication is even more serious than the problems posed by secondary structure, for two reasons. First, the protein-RNA interactions are heterogeneous. We can't model them using a single fudge factor. Second, ribosomal proteins are coded by nuclear genes. This corrupts the supposed genetic purity of mitochondrial DNA since it exposes the mitochondrial genes to selection pressures based on changes in the vastly more complicated nuclear genome.
5) Rate heterogeneity among different types of mutation at the same site is well documented. In loops, A is favored over G. The reverse is found in stem regions. Springer et al. (1995). Transitions are strongly favored over transversions [5]. One interesting consequence of nucleotide bias is that we cannot assume rate complementarity, e.g. the rate of G → C transition isn't necessarily the same as the reverse C → G transition. Nor can we assume homogeneity among transitions or transversions.
We could go on a bit longer, but the problem is obvious. "Mutation" rate varies in a very, very complex way: over time, between lineages, between sites, and between types of mutation. For this reason, we can't tell whether a site is saturated or not. A given site may be changing only slowly now, but we cannot say whether it changed very quickly at some point in the past. A site may give a strong phylogenetic signal for one group of lineages, but be completely meaningless for another group. We just don't know. In a series of papers, Arnason's group has developed some rather complex weighting schemes using, for example, four different rate classes for nucleotide locations, with some additional assumptions related to secondary structure. However, such models are very much less complex than real life and assume constancy over all lineages and 100 My of time. Ultimately, they are relatively arbitrary fudge factors, the type of weighting scheme that morphologists abandoned more than a decade ago.
In any case, the literature contains ample evidence that saturation is a major problem with the usual datasets. The proof comes from two sources: studies involving very small time scales and older studies which report total amounts of change.
As mentioned above, little alpha taxonomy has been done on a molecular level. Two relevant papers are those of Brant & Orti (2002) and Querouil et al. (2001). [Q+01] looks at the last 20 My of shrew evolution, while [BO02] looks at North American shrews on a timescale of 1-5 My. Querouil, working with 16S mtDNA, expressly found that partial saturation had occurred. Brant & Orti found significant saturation at many cytochrome c sites in much less time. Admittedly, these were third codon positions in a protein coding gene -- mitochondrial, but definitely not rDNA. However, the same authors were able to use the gene for 16S rRNA to obtain phylogenetically useful information, which necessarily requires significant changes on this 1-5 My timescale. Indeed, their data suggests to a very rough estimate) an overall rate of about 1% change per million years -- enough to make the use of the 16S gene highly problematic for ordinal studies. Again, these studies show lineage sensitivity. Arnason & Janke (2002), for example discovered that, although they consistently recover rat and mouse as sister taxa, the difference between the two is unreasonably large considering the relatively short time since divergence.
Another measure might be to compare the total amounts of change at the ordinal level. This work was done by Arnason's group in one early study, Krettek et al. (1995). Unfortunately this study used protein coding genes, rather than rDNA. Nevertheless it is useful food for thought. The data reveal some interesting patterns:
1. Differences between opossum and all eutherian orders were remarkably similar (27-33% of nucleotides or 30-41% of amino acids).
2. The differences between groups was always higher when expressed as amino acid changes, rather than nucleotide base changes (no, this is not a typographical error).
3. Ordinal level differences within Eutheria are the same as differences between opossum and any given eutherian order. (24-29% nucleotides or 30-42% of amino acids).
4. Differences below ordinal level (rat/mouse, seal/whale, cow/horse) show a different pattern: 12-17% nucleotides and 14-20% amino acids.
What does this suggest? We submit that the simplest explanation is gross saturation on scales of 50-100 My. If the system is fully saturated, then all eutherian orders will show about the same level of difference from each other. This accounts for observation no. 3. Moving above the ordinal level will provide no additional change. This explains observation no. 1. Assuming complete neutrality and completely random mutation, a nucleotide system reaches equilibrium at 75% change, while a saturated protein system equilibrates at 95% change (since there are only 4 nucleotides, but 20 amino acids). Any deviations from randomness or neutrality will reduce those numbers, easily to the 30 or 40% level reported by Krettek et al. The difference would explain the otherwise bizarre finding that there are proportionately more amino acid differences than nucleotide differences and accounts for observation #2. At lower taxonomic levels (shorter time frames), below the ordinal level, the system will be less saturated, so that total changes are markedly lower and (a more important point) amino acid changes are more in line with nucleotide changes: observation #4 [6].
In sum, the evidence for significant, even dominant, saturation is overwhelming. Indeed, as early as 1996, Springer & Douzery (1996) recognized that transitions, at least, were saturated in mammalian mitochondrial rDNA. If so, mtDNA has nothing to tell us about ordinal relationships in the mammals. Recently, one paper from the Arnason group has admitted that the ability of mitochondrial rDNA to trace eutherian phylogeny may be "quite limited" Mouchaty et al. 2000). Quite so.
The final point we will take up is the absolutely irrational compulsion of molecular phylogenists to discard the important data in their pursuit of phylogenetic white noise.
The study of mammalian mitochondrial DNA has yielded a good deal of interesting information noted in passing in the various papers on the topic. For example, the same paper of Krettek et al. (1995) was the first to clone the mitochondrial DNA from the common European hedgehog, Erinaceus. The authors found that Erinaceus mtDNA is the largest of the eutherian mtDNA molecules at 17442 BP. The extra length is derived from 2 long, repetitive regions in the 3' control region, accounting for about 2kBP. One of these regions contains a hypervariable number of repeats of the sequence TACGCA. This type of purine-pyrimidine alternation is apparently common in mammals. In different individuals, the repeat number varied from 5 to 46 repeats. The other repeated region contains AT-rich repeats, with 7 different repeated motifs lacking the usual purine-pyrimidine repetition. The pattern is complex, but showed no variaiton. It was identical in all clones examined. The authors also note that the NADH1 sequence is 1 amino acid shorter than in other mammals.
Now here is real information. Could we map the characteristics of the control region across the mammals? Could we look at the types of repeats, their variability, base composition, motif substructure, and so on? Of course! Could this be phylogenetically useful? We'll never know. The reason we'll never know is that the field of molecular phylogenetics is focused on the original paradigm: find the cleanest, longest run of DNA with 1:1 nucleotide homology. Throw out everything else. Krettek et al. used exactly none of this information in their analysis because it didn't fit into the paradigm they had in mind. This is literally one-dimensional thinking. It discards all information about secondary or tertiary structure. Mouchaty et al. 2000a) provides another example of this crabbed approach to molecular phylogenetics.
When mitochondrial DNAs are compared, molecular workers line up all the sequences of interest and systematically discard nucleotide positions which do not show across-the-board, 1:1 homology. See, e.g., Querouil et al. (2001); Stanhope et al. (1998a). It is likely, in the case of rDNA genes, that this is a correct move. For the most part, the eliminated sequences are hypervariable loop regions. However, it is more than slightly odd that no one seems to have even tried to squeeze out data on the size, base composition, exact position, or motif composition of these loops. For that matter, the highly variable amino acid composition of the electron transport proteins coded by mtDNA deserves some attention. Are there functional implications for the energy levels at which they act in the oxidative pathways? On their kinetics or membrane-binding properties? Is there a functional or phylogenetic pattern here? Without the willingness to embrace a more flexible paradigm of molecular phylogenetics, we will never know.
In the interminable prologue to this essay, we promised that we would leave the vWF portion of the study alone -- but of course we lied. With respect to the molecular paradigm, it's just too good an example to pass up. So, once again, the temptation of the quick thrill and the cheap shot has overcome whatever petty scruples may have survived our descent into the moral disintegration of advancing age. We blame it on entropy.
Stanhope y Cie. [S+98a] state that they used a nuclar gene fragment, "exon 28 of the gene for von Willebrand factor ... ." A few actual facts about vWF and its gene are illuminating. Classically, vWF was described as a protein involved in platelet aggregation and binding to injured tissues in the process of clotting and wound healing. [M+89]. The happy certainties of the 1980's were soon overwhelmed by findings that homologues of "vWF" were involved in a host of other activities, as varied as cell adhesion, extracellular matrix formation, and in integrin receptors. In fact, vWF can be traced back to DNA metabolism in single-celled Eukarya which, needless to say, have no platelets to aggregate [WH02]. The gene is extraordinarily complex. It contains 52 exons. Exon 28 is the largest, but still rather small at 1379 BP (in humans) [M+89]. This exon corresponds to domains A1, A2 and part of A3 of the protein [M+89]. "What's that?" you ask. Here the plot thickens. According to the same source, it turns out that:
Over 90% of the vWF precursor consists of four distinct repeated domains present in 2 to 5 copies each in the order: Dl-DZ-D"D3-Al-A2-A3-D4-Bl-B2-B3-Cl-C2. The A domains of vWF are about 220 amino acids in length and appear to be homologous to segments of complement factor B, complement component C2, cartilage matrix protein, "1-collagen type VI, and the "-subunits of the leukocyte adhesion receptors Mac-1, p150, 95, and LFA-1.
So is human vWF, and particularly exon 28 thereof, really a protein or domain, or is it a family of genetic chimaerae made up of bits and pieces of other stuff? The answer is important. If human vWF is one of a family of related chimeric segments, how can we be sure that the "vWF" gene fragment we have from another organism is actually the same protein, or a slightly different protein used for a different purpose? We have no such assurance. I hasten to add that we are not merely speculating. [WH02] identified 500 different proteins from various organisms which all had the vWF A-domain motif. In fact [M+89]: "vWF is the product of a mosaic gene which contains motifs shared by several otherwise unrelated protein families. These may have arisen by repeated gene segment duplication and exon shuffling". As if to prove the point -- and perhaps it was -- [M+89] expressly noted the experimental problems they experienced with a pseudogene [7] in the human system, stating that: "The pseudogene sequences interfere with the analysis of vWF gene structure by Southern blotting and cause some difficulty in the identification of restriction fragment length polymorphisms for the gene." Thus, once again, we may legitimately ask the question, do we really have the authentic vWF from all these mammalian orders, or is it a first cousin (orthologue), more distant relative (paralogue) or even the conveniently forgotten idiot bastard son (pseudogene)?
While Molecularions may fret over such stuff, it is the very sort of thing that morphologists labor to find. How many copies? Where? What functions? How else does this motif get used? How do internal mutations and changes in the surrounding domains alter the three dimensional conformation, quaternary structure, biochemical activity and binding specificity in different taxa? Surely the billion-year story of this motif, which Whittaker & Hynes barely outline in their marvelous paper, really would allow us to trace the phylogeny of life on a molecular level. This is, in fact, the real data. Yet DNA phylogenists simply throw it away. At best, they regard these data as an embarassing source of error. At worst, it is all swept under the rug. Thus, the experimental paradigm of DNA phylogeny is fundamentally just wrong. It leads its devotees into error: downplaying and ignoring precisely the information which would answer the questions at hand.
We have -- once again -- rattled on too long. The ultimate point is simple. If we are right, or even mostly right, then molecular phylogenetics as currently practiced is worse than a waste of time. It is actually obscuring the relevant data. The problem is really hubris: "This is DNA stuff! We don't need your moldy morphology, your boring biochemistry, your fragments of fossils or your icky embryology! Your sciences are obsolete, your knowledge useless. We're going to show you how we do things downtown!"
Maybe. But not at this time. Not yet. Not until the molecule mob absorb the techniques of morphology, coordinate with the fossil record, reach out to the possibilities of biochemistry and genetics, think a little about evolutionary biology and physiology, and go through the painful drudgery of alpha taxonomy. Until then, we prefer the martini picks. We are shaken, you understand -- but not yet stirred. ATW030803; revised ATW030807.
References: Arnason & Janke (2002) [AJ02]; Arnason et al. (2002) [A+02]; Brant & Orti (2002) [BO02]; Douadya et al. (2002) [D+02]; Krettek et al. (1995) [K+95]; Li (1997) [L97]; Liu et al. (2001) [L+01]; Mouchaty et al. 2000) [M+00]; Mancum et al. 1989) [M+89]; Mouchaty et al. 2000a) [M+00a]; Querouil et al. (2001) [Q+01]; Seiffert & Simons (2000) [SS00]; Springer & Douzery (1996) [SD96]; Springer et al. (1995) [S+95]; Stanhope et al. (1998) [S+98]; Stanhope et al. (1998a) [S+98a]; Whittaker & Hynes (2002) [WH02]; Yang & Yoder (1999) [YY99].
[1] Hetaerae εταιραι) were a group of specially trained and educated courtesans who were allowed an odd sort of social equality with men in ancient Athens.
[2] Perhaps many early workers in this area produced their results with elegance and grace. However, the present author was one of those workers, and his experiments, at least, were notable for their lack of finesse.
[3] Bayesian methods are very fashionable just now, and progress in that area has been rapid. It is not unrealistic to suppose that a Bayesian method related to principle components analysis could be devised to predict structure from sequence and vice-versa. Given that tool, one might begin to test morphological ideas with sequence data.
[4] Even tiny deviations from neutrality can have huge consequences [L97].
[5] The transition (TS) mutations are G ↔ C and A ↔ T. Transversions (TV) involve a change from a purine to a pyrimidine or vice-versa. i.e., (G or C) ↔ (A or T). There are indications that the mitochondrial TS/TV ratio varies among mammal lineages, and that they are subject to other sources of variation which have not been identified. Yang & Yoder (1999). We may add that numerous papers have commented on the lineage heterogeneity of mutation rates. Whether this is simply due to differences in typical population sizes and generation times, or reflects something more complex, we cannot say.
[6] In a perfectly random world, without selection pressures, a nucleotide change would result in an amino acid change only about 45% of the time. Thus we'd expect to see about twice as many nucleotide changes as amino acid changes. The odd thing is that Krettek et al. never even get close to this ratio. We would also think, a priori, that deviations from neutrality would enforce selection pressures at the protein level, not the nucleotide level. If so, we would expect to see an even higher imbalance in favor of nucleotide changes over amino acid changes in mutations which have become fixed. Saturation is clearly present, but something very odd seems to be going on here beyond mere saturation.
[7] The nucleus is a complicated place. Genes, or parts of genes, are sometimes duplicated and transposed elsewhere in the genome. These duplicates are generally non-functional, but may get picked up by other gene groups for unrelated functions.
checked ATW050623